Algo-trading Cryptocurrency – Research
I was having this strategy in my mind for a while, but because algorithmic trading with stocks, forex and other classic instruments is not really straight-forward and you need quite big funds to start I have never made it to the production. With crypto its different — you are able to start trade with few bucks in pocket and few lines of code.
Backtesting
So before I hit the start button, I would like to know how my strategy performed in the past and also to be able to plug’n’play the strategy from staging to production. So I have created following structure, which will allow me to replace the Account and the Runner in production.
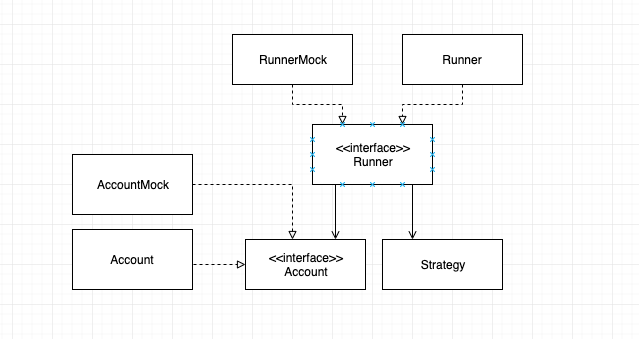
I also would like to be able to hit stop button, when in production. So I have set it up as Node.JS express project. That will allow me create control interface in the future, that will be accessible from anywhere.
Data
Coinbase has an endpoint for historical data, but it has a limit for 300 items. So you have to do multiple calls to obtain required time span. Below is my util function that downloads all the data for Bitcoin.
const downloadData = async (start, end, timeframe) => { | |
/** | |
* time bucket start time | |
* low lowest price during the bucket interval | |
* high highest price during the bucket interval | |
* open opening price (first trade) in the bucket interval | |
* close closing price (last trade) in the bucket interval | |
* volume volume of trading activity during the bucket interval | |
* [0, 1, 2, 3, 4, 5] | |
* [time, low, high, open close , volume] | |
* [ 1565654400, 10746, 11438.39, 11389.25, 10854.92, 12500.34295603 ], | |
*/ | |
start = new Date(start).getTime() | |
end = new Date(end).getTime() | |
let tempEnd; | |
let data = [] | |
do { | |
tempEnd = start + 300 * timeframe * 1000 | |
tempEnd = tempEnd > end ? tempEnd = end : tempEnd = tempEnd | |
console.log(`Downloading data from: ${new Date(start).toISOString()} to ${new Date(tempEnd).toISOString()}`) | |
let newData = await publicClient.getProductHistoricRates('BTC-EUR', | |
{ | |
start: new Date(start).toISOString(), | |
end: new Date(tempEnd).toISOString(), | |
granularity: timeframe | |
}, | |
); | |
console.log(`Starting with ${newData[0]} ending with ${newData[newData.length - 1]}`) | |
// to prevent too many calls error | |
await new Promise(resolve => setTimeout(resolve, 3000)); | |
start = tempEnd | |
//We get the data from oldest to newest so we have to reverse them | |
data.push(...newData.reverse()) | |
} while (tempEnd < end) | |
return data | |
} |
Watson Strategy
Here is my strategy. That follows long term mood with EMA. It has 3 variables — buy ratio, sell ratio and stop-loss. And basically watch two patterns:
- the long term mood – if it is bullish then prefer going long; if it is bearish prefer going short.
- short term oscillation – if a candle ends below open -> buy; if candle ends above open -> sell
here is how it looks in code, that may be more descriptive.
// STOP LOSS | |
if (equityPrev && equity/equityPrev < stopLoss) { | |
acc.sell(close, 1) | |
return; | |
} | |
// down trend | |
if (emaValue < emaPrevValue) { | |
sliceBuy = 0.0001 | |
sliceSell = 0.001 | |
} | |
// up trend | |
if (emaValue > emaPrevValue) { | |
sliceBuy = 0.1 | |
sliceSell = 0.01 | |
} | |
// open > close (down-trend) | |
if (open > close) { | |
acc.buy(close, sliceBuy) | |
} | |
// open < close (up-trend) | |
if (open < close) { | |
acc.sell(close, sliceSell) | |
} |
Results
Backtesting from 2019/01/01 to 2019/11/15 (11,5 months)
Backtesting from 2016/01/01 to 2019/11/15 (~4 years)
Download
You can download or fork the repo here.
Note
I didn’t have much time to test it yet so it may contain some bugs.